
Light to Insight
Support
Downloads and updates
Download recent software updates and user manuals for your detector by clicking here using the login details provided with your device when it was delivered. If you do not have these or require help, please contact us.

Frequently asked questions
The focusing length is the distance between the detector light output on the front lens and the object. Detector focus distances are between 5 and 18 mm depending on detector configuration. By default, this distance is set at 9 mm. There is a sweet spot at the optimized focusing distance and the efficiency of the detector is best at this point.
ESElog and Fluo Sens Integrated Detectors are highly sensitive and can detect fluorescent dyes down to pg/mL concentrations. There is an internal amplifier built into the device that can be adapted according to the customer’s application. Usually, during customization process, the appropriate amplification is determined for the detector.
ESElog or Fluo Sens Integrated Detectors have two independent built-in excitation and emission channels, with each having its own set of filters. Detectors can therefore be used with 3 wavelength combinations: Excitation 1 / Emission 1, Excitation 1 / Emission 2, Excitation 2 / Emission 2.
The unit of measured values is given in millivolts (mV). The range is between 0 and 2500 mV.
We use Modbus ASCII, via serial interface, and the message starts with “:”. Refer to your detector handbook to find details of the serial port configurations. Some examples of Modbus messages are included for you to try on your PC’s serial terminal.
Yes, the software “FL Digital” can be used if the TTL adapter is available.
ESElog and Fluo Sens Integrated Detectors are able to detect 100 measurement points per second per wavelength when used in standard mode.
The measurement time depends on the implemented measurement mode:
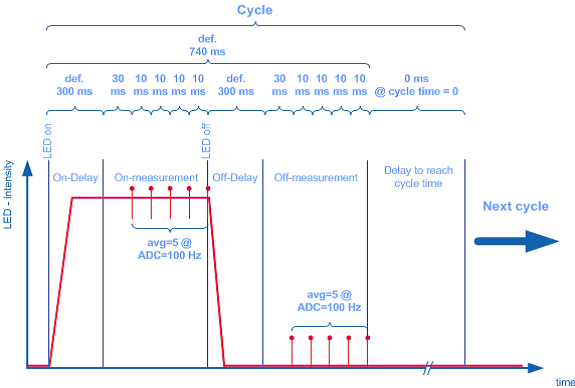
Using normal on-off mode:
The parameter Cycletime defines each cycle duration.
The time is divided as seen in the graph below: LED on-delay (to adjust LED electronics) + on-measurement + off-delay + off-measurement + Cycletime-delay.
For example; if you set the Cycletime to 1 second, the detector will perform the number of measurements defined in each cycle, then wait until the cycle time is reached before sending the data and starting the next cycle. In the graph the detector takes 5 on-measurements and 5 off-measurements, all will take 740 ms, so a delay of 260 ms will be implemented at the end to reach 1 second total cycle time.
If Cycletime was set to zero, no delay will be implemented after the off-measurements.
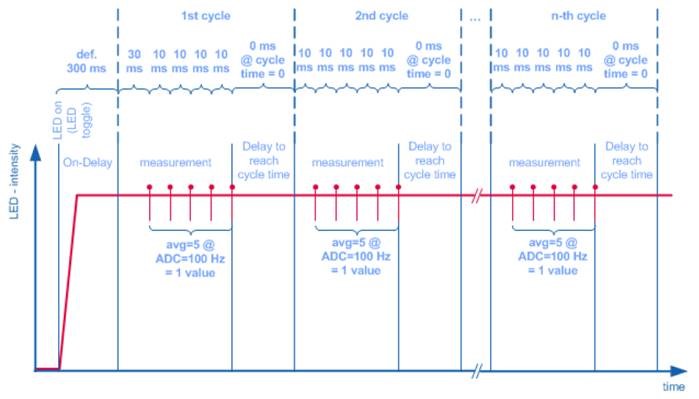
Using scan mode:
This mode is faster than the on-off mode. Each cycle is still controlled by the Cycletime parameter, but the difference is that all the data is sent after all cycles are finished, not after each single cycle (see graph below). Which means if the Cycletime is set to zero, all cycles will last as long as the measurements need plus the LED-On delay which happens only once at the beginning. Then at the very end the data which is saved in the detector’s FRAM (up to 1500 cycles) is sent to the receiver at once.
The measurement time depends on the implemented measurement mode:
Using normal on-off mode:
The parameter Cycletime defines each cycle duration.
The time is divided as seen in the graph below: LED on-delay (to adjust LED electronics) + on-measurement + off-delay + off-measurement + Cycletime-delay.
For example; if you set the Cycletime to 1 second, the detector will perform the number of measurements defined in each cycle, then wait until the cycle time is reached before sending the data and starting the next cycle. In the graph the detector takes 5 on-measurements and 5 off-measurements, all will take 740 ms, so a delay of 260 ms will be implemented at the end to reach 1 second total cycle time.
If Cycletime was set to zero, no delay will be implemented after the off-measurements.
Using scan mode:
This mode is faster than the on-off mode. Each cycle is still controlled by the Cycletime parameter, but the difference is that all the data is sent after all cycles are finished, not after each single cycle (see graph below). Which means if the Cycletime is set to zero, all cycles will last as long as the measurements need plus the LED-On delay which happens only once at the beginning. Then at the very end the data which is saved in the detector’s FRAM (up to 1500 cycles) is sent to the receiver at once.
Cycletime must be set in seconds. The system automatically calculates the delay needed in milliseconds in order to reach the set Cycletime.
The system uses MODBUS-ASCII protocol sending and receiving 16-bit data via serial interface (RS232, RS485…) in a master/slave configuration. Details about the data structure can be found in the detector’s manual.
In order to use the detector with a MCU that does not have an operating system, serial MODBUS protocol must be implemented in the MCU and it must be set as the master.
- For physical/electrical connections: In the FLUO SENS Manual covers the information regarding connections in section 3: Connections. All “Ground” pins (1, 2, 6 & 9) can be connected to the ground, the +5V pin (8) to a +5V power source, and the TxD & RxD (3, 5 respectively) to the MCU’s RxD & TxD pins – Note hereby that the TxD pin of the detector must be connected to the Rx pin of the MCU and vice versa.
- Serial communication must be set at baudrate 57600, and the new line character “rn” must be used at the end of each request. You can optionally set read and write timeouts to 200 ms.
- Section 9: Operation as well as 10: Configuring a MODBUS-Protocol in the manual explain in detail request and response formats. If these are implemented, communication with the detector shall be possible. Examples are found in section 10.7.
Note that serial MODBUS libraries must be included in the MCU code. Some open-source libraries are available in Github.
RXD and TXD interfaces have TTL level.
The grounding is done inside the detector through the electronics, so there is no need for extra grounding for the housing.
No. The test data will be available at the end of the measurement to be pulled from the value registers. The application SW should trigger the measurement, wait until it is done and then read out the values.